Ohio · City profile
Crime Map, Crime Rate and Safety Score in Cuyahoga Falls, OH
Explore neighborhood Safety Scores in Cuyahoga Falls, see which ZIP codes its residents live in, and compare the closest cities.
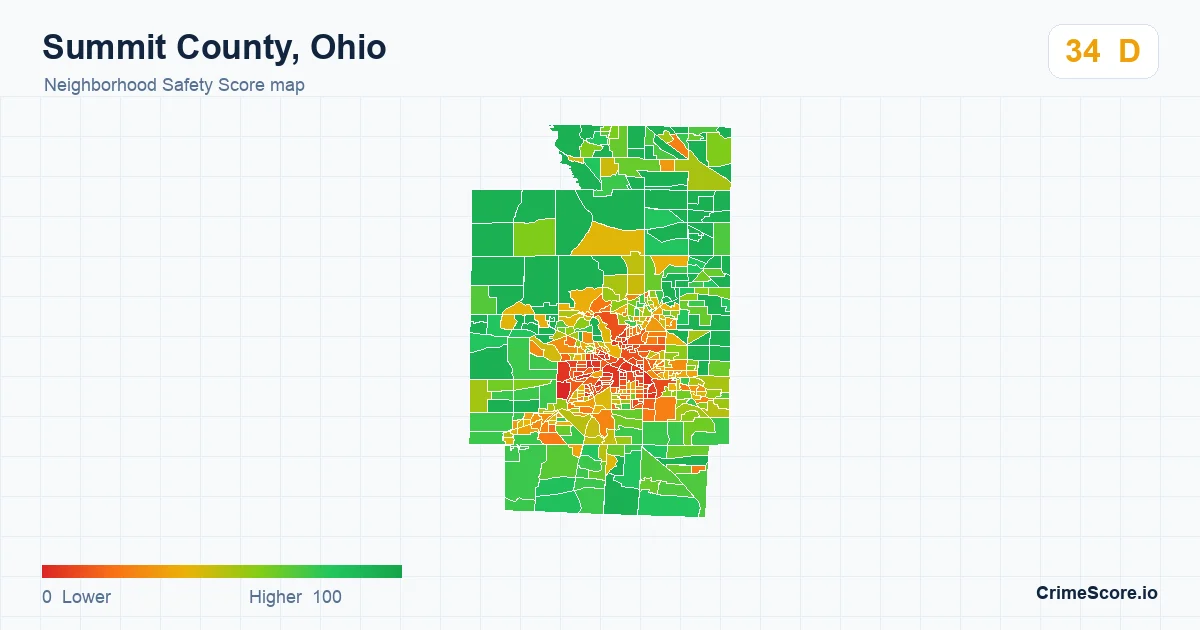
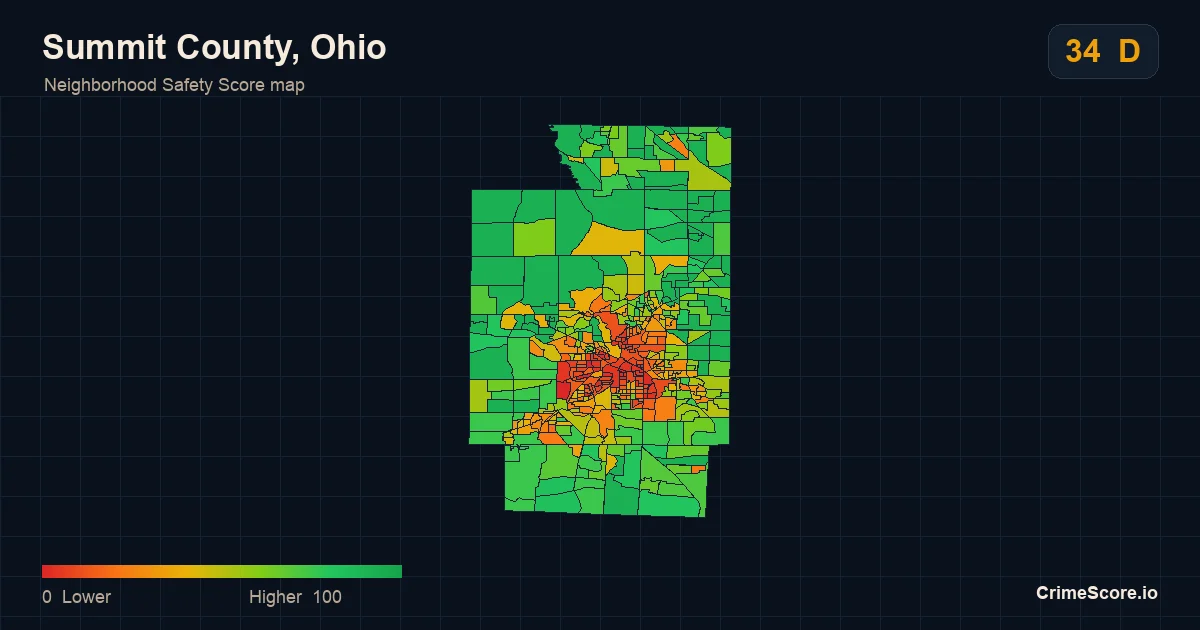
Explore neighborhood Safety Scores around Cuyahoga Falls. The map can include areas outside the city limits.
Is Cuyahoga Falls, OH safe?
Cuyahoga Falls, Ohio has a CrimeScore Safety Score of 50 out of 100, grade C, below the Ohio statewide score of 53. An estimated 21% of its residents live in neighborhoods graded A or B, compared with 45% statewide. Safety Scores are modeled estimates, not official crime rates.
- Safety Score
- 50 / 100
- Residents in A or B neighborhoods
- 21%
- Residents in D or F neighborhoods
- 32%
- Scored neighborhoods
- 54
How Cuyahoga Falls compares
Cuyahoga Falls scores 3 points below the Ohio statewide score of 53. Both scores average neighborhood scores weighted by population, so they compare directly.
Cuyahoga Falls lies in Summit County, which has a county Safety Score of 34, grade D.
County Safety Scores describe whole counties and are measured differently, so they are not an average of the neighborhoods inside Cuyahoga Falls.
Neighborhoods inside Cuyahoga Falls
54 scored neighborhoods (Census block groups) with residents lie at least partly inside Cuyahoga Falls, 48 of them mostly inside it. Among those 48, the lowest scores 19, the highest 92, and the middle 80% range from 26 to 75.
ZIP codes where Cuyahoga Falls residents live
Listed by the estimated share of Cuyahoga Falls's residents who live in each ZIP code. A ZIP score covers the whole ZIP, including any part outside the city.
Higher scores indicate safer modeled conditions. Scored areas are Census block groups, not a coverage percentage.
Closest cities in Ohio
- Stow Safety Score 76 · grade B · 3.9 miles
- Tallmadge Safety Score 79 · grade B · 4.8 miles
- Akron Safety Score 29 · grade D · 4.9 miles
- Hudson Safety Score 88 · grade A · 7.2 miles
- Kent Safety Score 15 · grade F · 7.2 miles
Distances are measured between the population-weighted centers of each city's scored neighborhoods.
About Cuyahoga Falls
Cuyahoga Falls has an estimated 50,979 residents (2024 Census estimate) and 25.8 square miles of land inside its 2020 city limits. Its city score combines 54 scored Census block groups that lie at least partly within those limits.
How this page is built
ZIP codes are listed by the estimated share of the city's residents who live in them, from 2020 Census block-group population spread evenly over each block group's land. The city score is not an average of ZIP scores.
For product teams