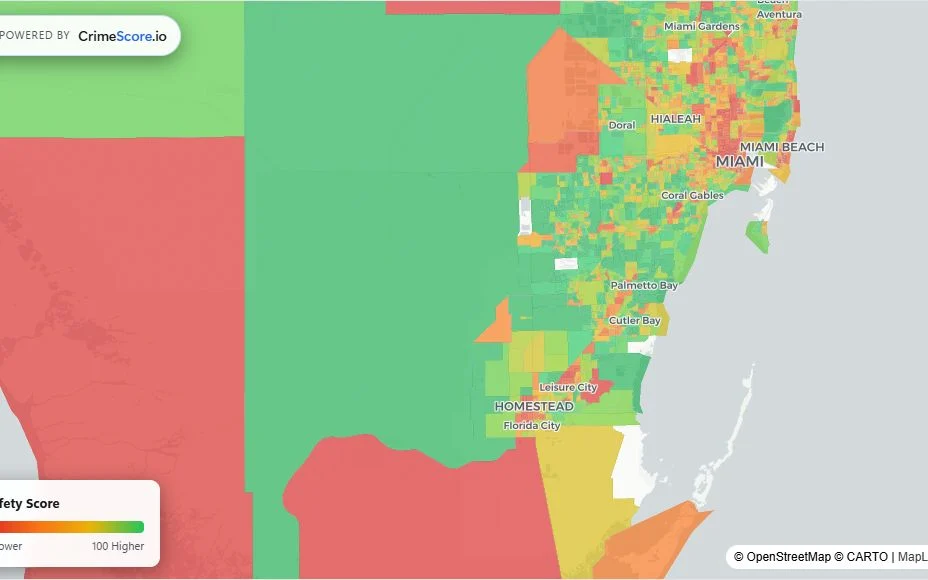
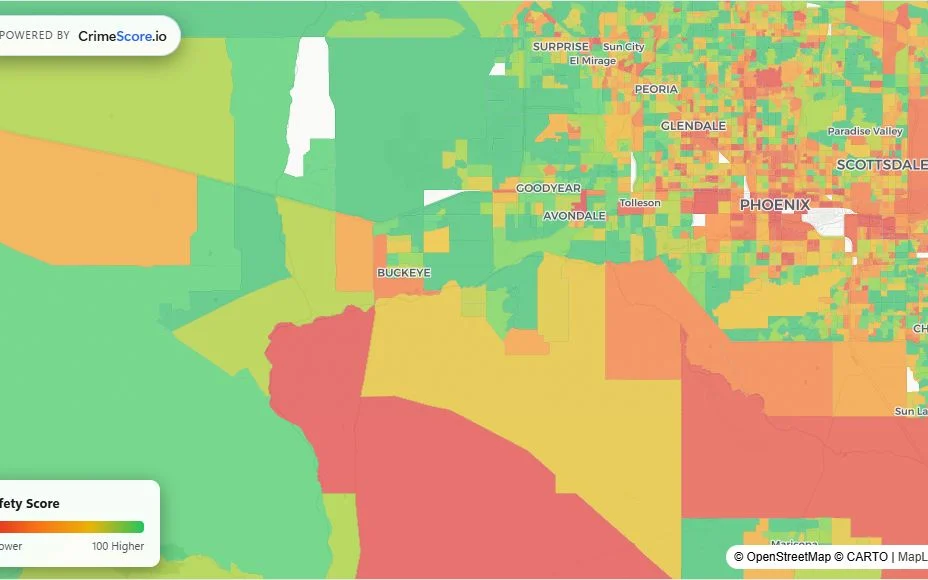
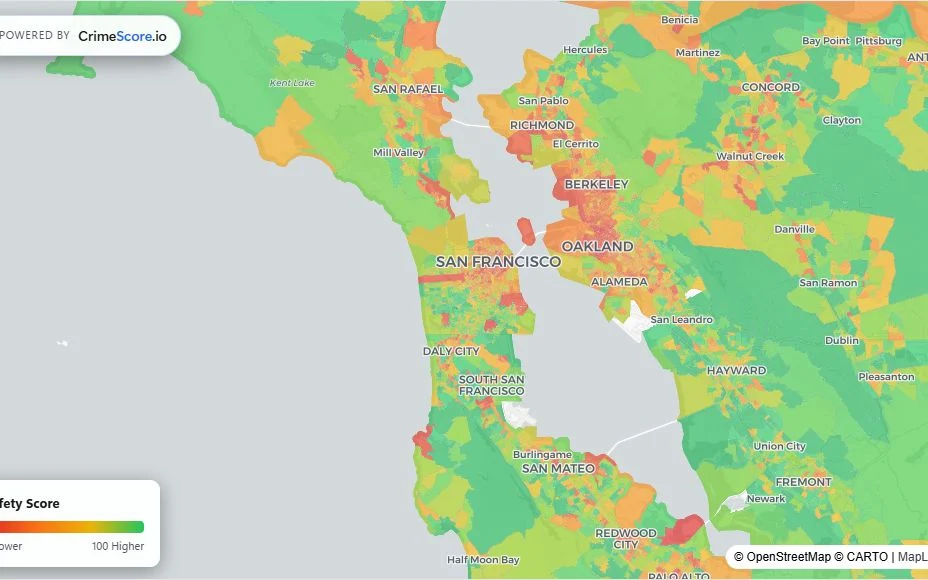
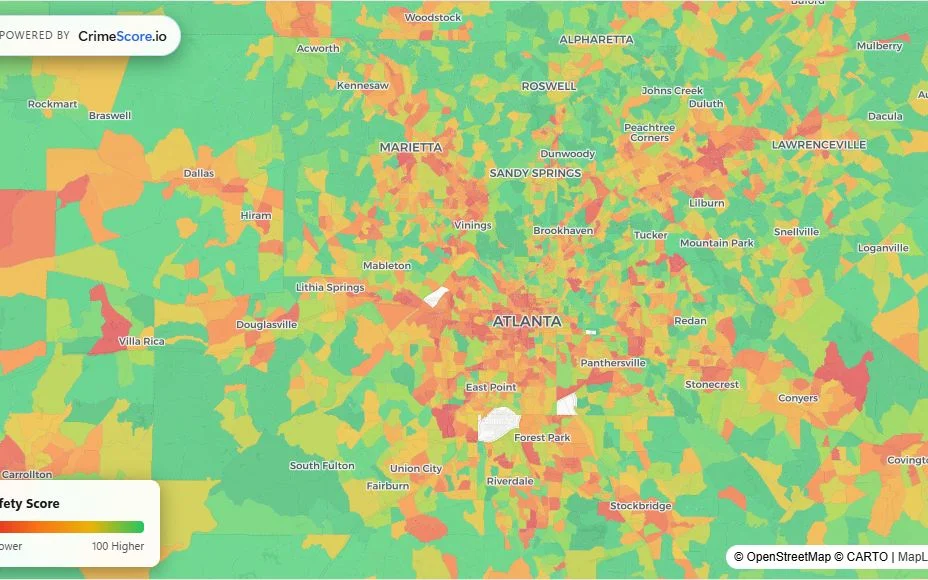
Safety Map · Real Product View
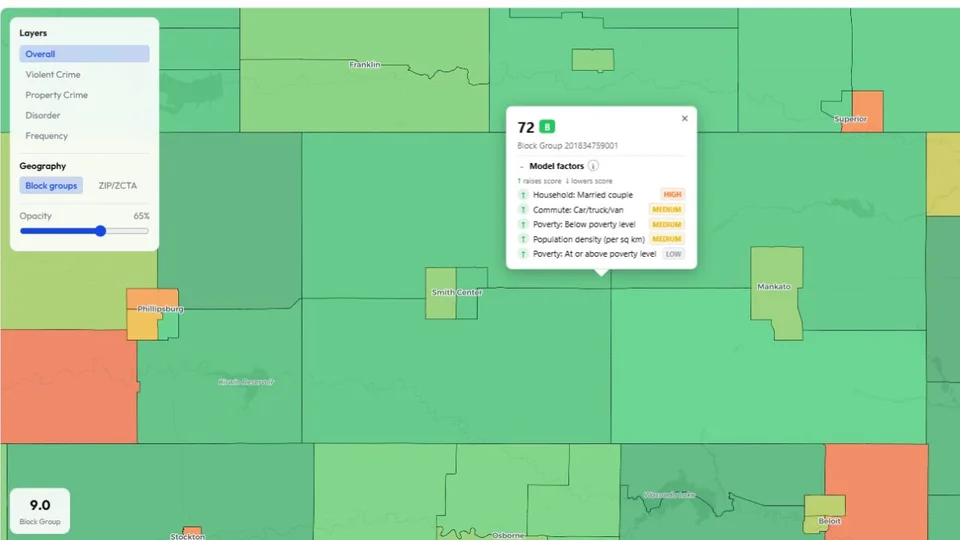
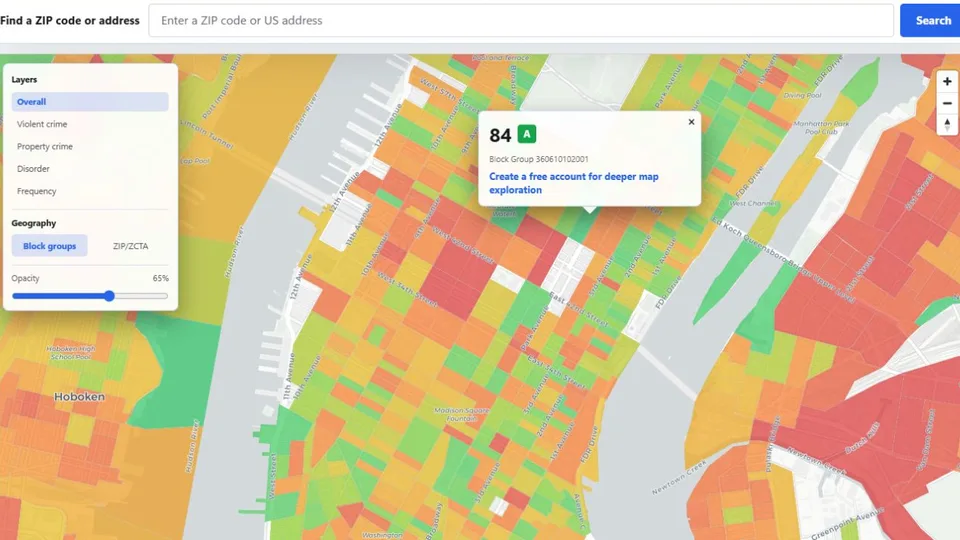
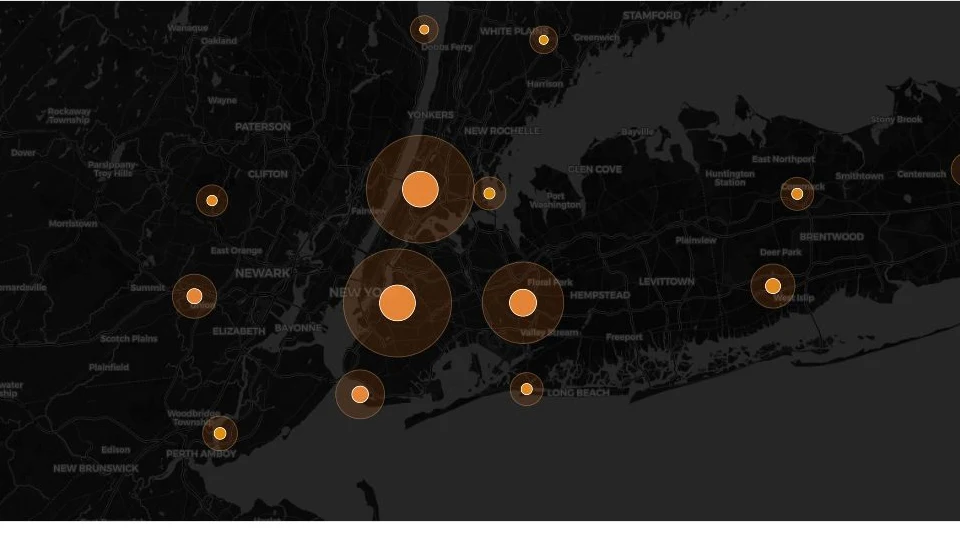
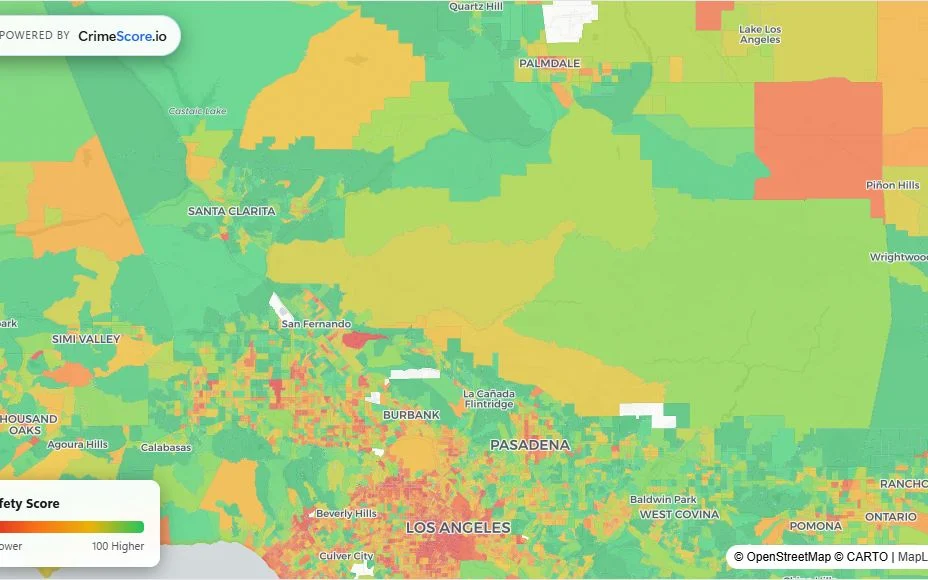
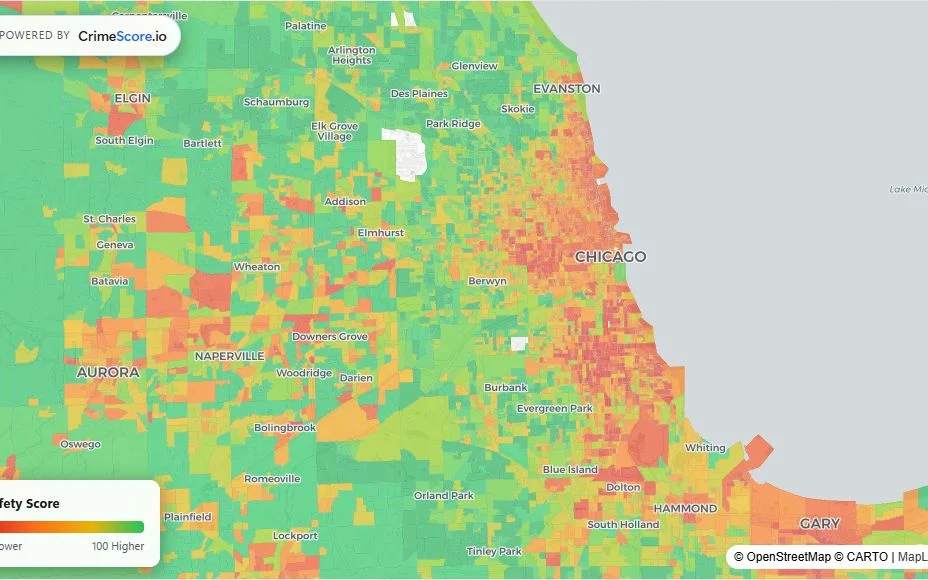
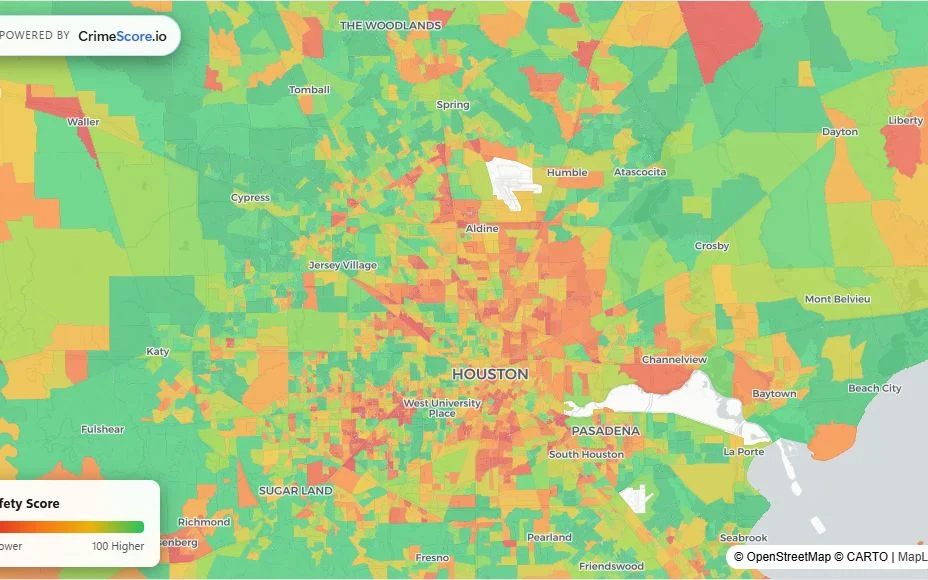
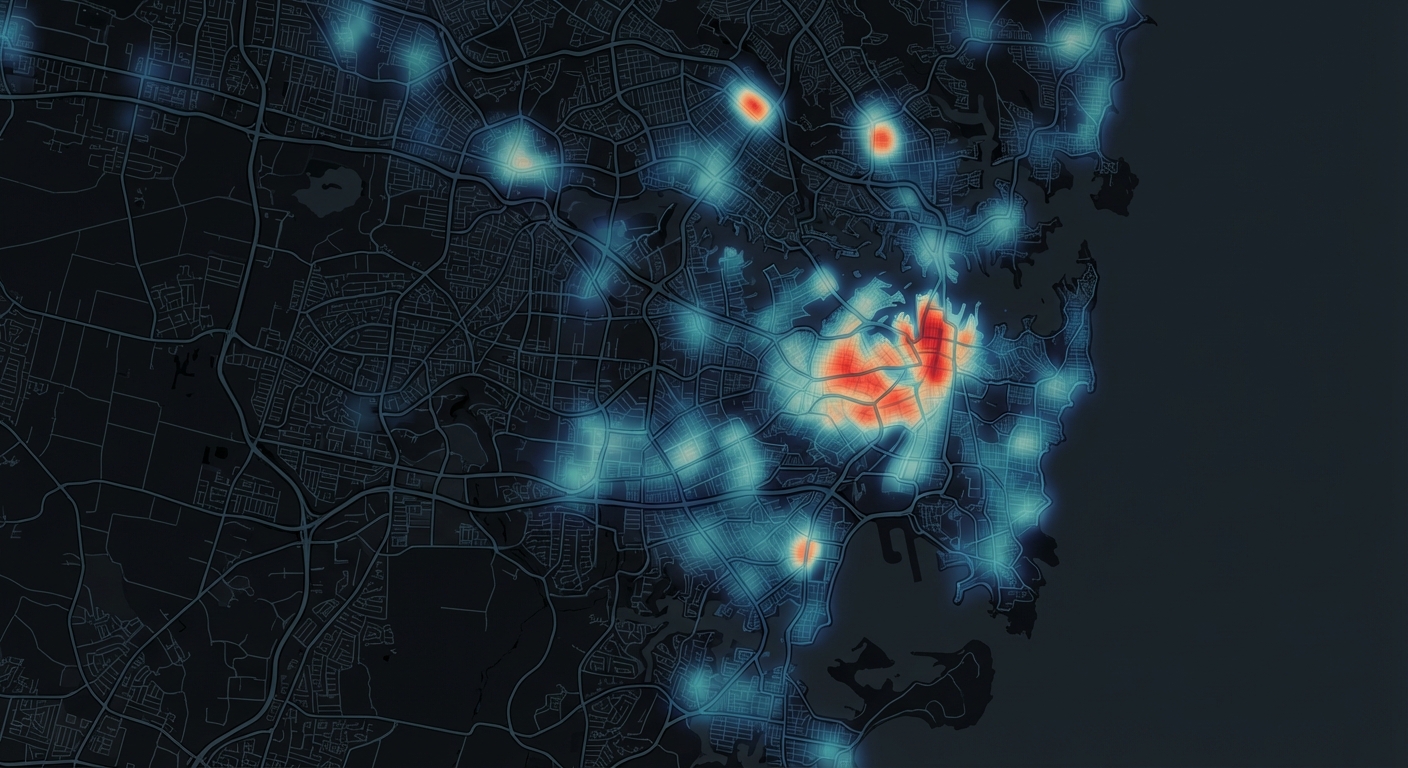
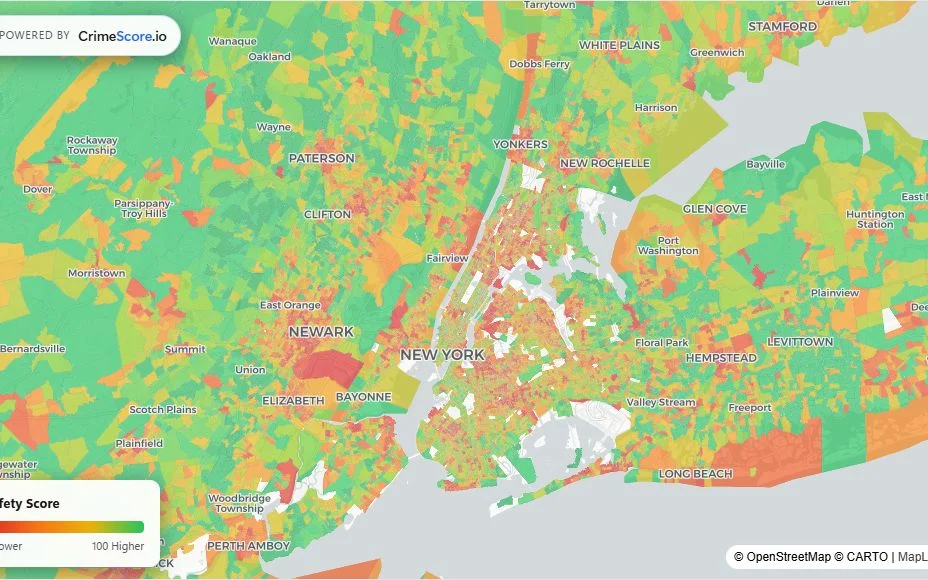 Actual CrimeScore map
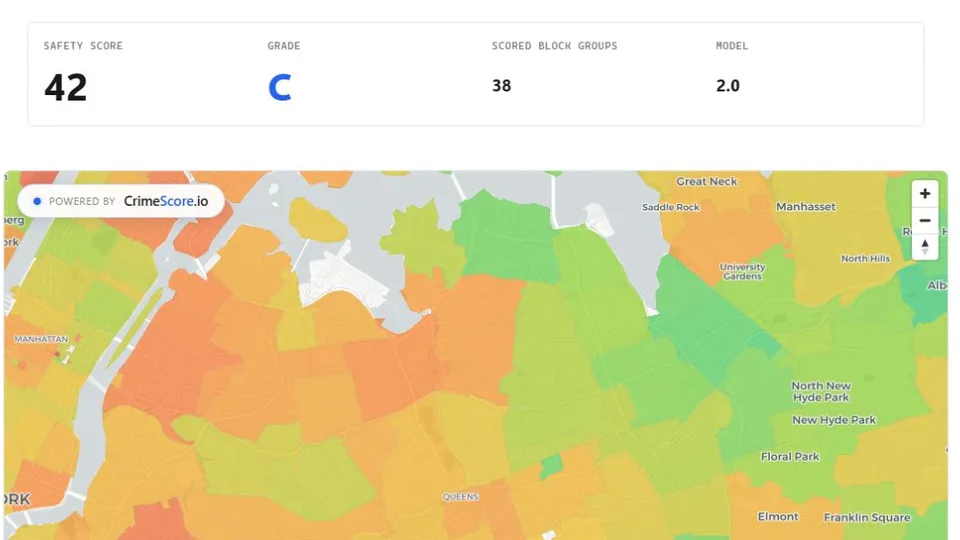
 Example Score · Grade D
28 /100 Violent Crime 22 / 100
Property Crime 31 / 100
Disorder 27 / 100
Frequency 24 / 100
Score detail Available on Starter+
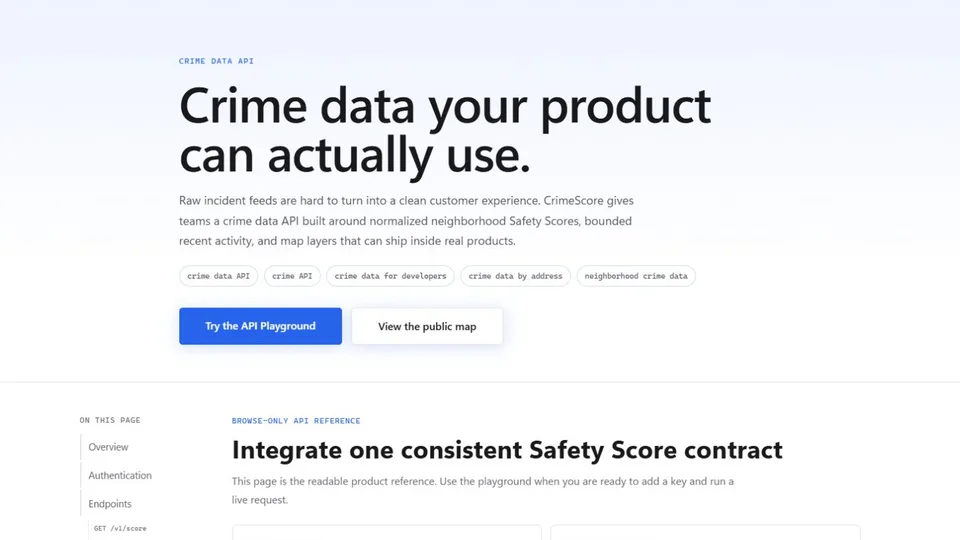
API Payload Examples OpenAPI
GET /v1/score?lat=40.7128&lng=-74.006
{
  "geoid": "360610031002",
  "resolved": {
    "lat": 40.7128,
    "lng": -74.006,
    "state": "NY",
    "county_fips": "061"
  },
  "safety_score": 28,
  "safety_grade": "D",
  "components": {
    "violent_crime": 24.8,
    "property_crime": 37.9,
    "disorder": 29.2,
    "frequency": 31.5
  },
  "data": {
    "census_vintage": "2024",
    "model_version": "2.0"
  }
}
GET /v1/score/details?lat=40.7128&lng=-74.006&component=property_crime
{
  "geoid": "360610031002",
  "resolved": {
    "lat": 40.7128,
    "lng": -74.006,
    "state": "NY",
    "county_fips": "061"
  },
  "component": "property_crime",
  "safety_score": 37.9,
  "safety_grade": "D",
  "contributors": [
    {
      "label": "High rental vacancy rate",
      "direction": "lowers_safety_score",
      "impact": "medium"
    },
    {
      "label": "High median household income",
      "direction": "raises_safety_score",
      "impact": "medium"
    }
  ],
  "data": {
    "census_vintage": "2024",
    "model_version": "2.0"
  }
}
GET /v1/incidents/nearby?lat=40.7128&lng=-74.006&radius_m=5000
{
  "capturedAt": "2026-06-23T16:00:00.000Z",
  "center": {
    "lat": 40.7128,
    "lng": -74.006
  },
  "radius_m": 5000,
  "hours": 24,
  "limit": 25,
  "count": 2,
  "incidents": [
    {
      "id": "crimescore_9f3a2b7c1d4e5f60718293ab",
      "label": "Theft",
      "categories": [
        "property"
      ],
      "latitude": 40.7142,
      "longitude": -74.0028,
      "reportedAt": "2026-06-23T13:42:00Z",
      "distance_m": 384
    }
  ]
}