CrimeScore original research · 2026-07-14
How Much Neighborhood Safety Can Vary Within a U.S. ZIP Code
A ZIP-level score is useful for a quick summary, but it can hide meaningful neighborhood variation. We compared stored ZIP code estimates with their intersecting Census block-group Safety Scores to measure that gap.
Executive summary
ZIP averages often compress a much wider local range
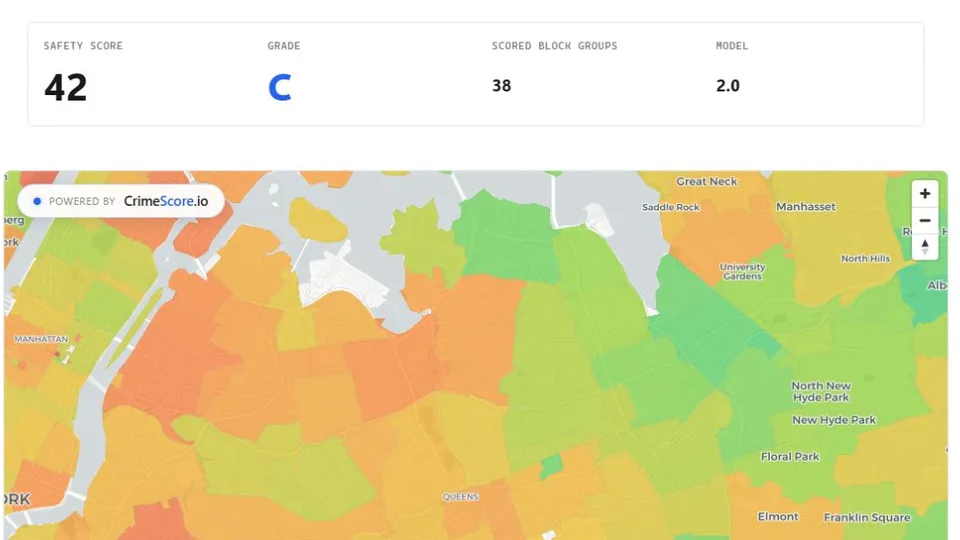
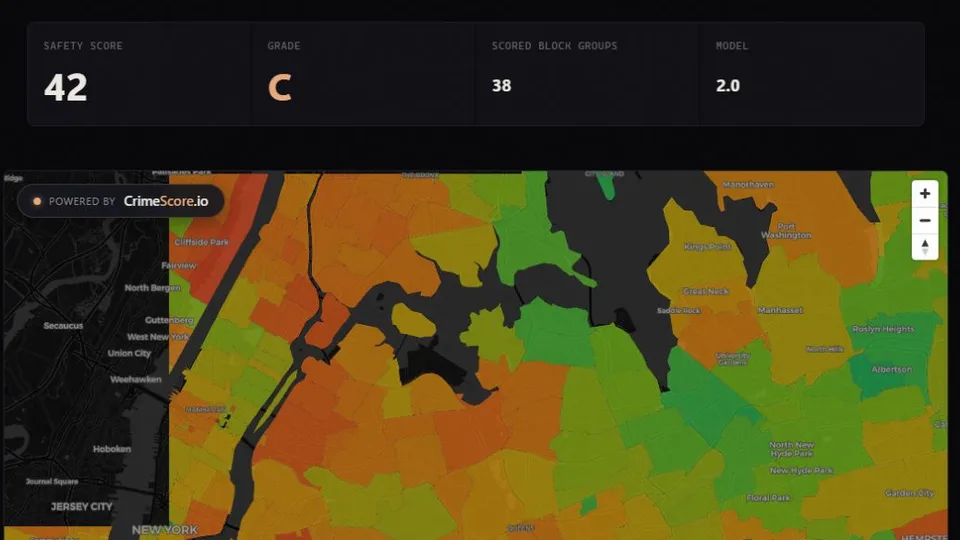
Across the analyzed ZIP code areas, the median difference between the area estimate and the median intersecting block group was only 5 points. The distribution inside the same ZCTA was much wider: the median spread between its 10th- and 90th-percentile block groups was 41.6 points. A rollup can summarize an area well while still concealing substantial variation inside it.
Representative metros
The pattern appears across different market types
These are descriptive samples from fixed ZIP lists in five large metropolitan areas. They are included to illustrate the nationwide result, not to rank metros or identify a safest or least-safe market.
| Metro sample | ZCTAs | Median middle spread | Illustrative ZIP | ZIP rollup | Block-group P10–P90 |
|---|---|---|---|---|---|
| New York | 7 | 49.8 points | 11367 | 42 (C) | 4–60 |
| Los Angeles | 5 | 33.8 points | 90024 | 16 (F) | 2–58.2 |
| Chicago | 5 | 24.5 points | 60629 | 34 (D) | 7.9–64 |
| Houston | 5 | 56.2 points | 77019 | 41 (C) | 21.2–88.4 |
| Atlanta | 4 | 63.1 points | 30349 | 47 (C) | 3.8–81 |
Methodology
What was measured
- Safety Score: a higher-is-safer CrimeScore estimate from 0 to 100.
- Grade: A is the highest grade and F is the lowest.
- Block group: a small Census statistical geography used for the detailed map layer.
- ZCTA: a Census ZIP Code Tabulation Area used as the statistical geography behind a ZIP code estimate.
- ZIP code estimate: the stored population-weighted CrimeScore estimate for the matching ZCTA.
- Middle spread: the 90th-percentile block-group score minus the 10th-percentile score.
The analysis used model version 2.0 and the public-data context adopted for those releases. A ZCTA was included only when its relationship-derived block-group count exactly matched the stored count. This left 28,551 validated ZCTAs. The block-group distribution is unweighted, while the stored ZCTA rollup remains population weighted.
Limitations
How not to interpret the findings
The results describe variation in modeled neighborhood Safety Scores, not incident counts, causal effects, individual behavior, or future outcomes. ZCTAs approximate ZIP delivery areas and can change. A block group that intersects only a small part of a ZCTA can affect the full minimum-to-maximum range, which is why the report emphasizes the 10th-to-90th percentile spread. CrimeScore should not be used as the sole basis for housing, lending, insurance, or other high-impact decisions.